Home Page
Loading

Map Item Details
Radius Search
Total:
Loading
Map Item Details
Loading
Add Comment
Loading
CRM Company Lookup
Enter a Company ID to view CRM details:
Loading
Save Scenario
Loading
Select an item from the list
Name: {{name}}

Explore the map tools
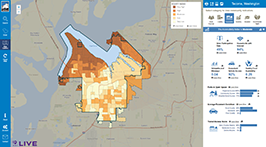
City of Columbus Community Map
Welcome to the City of Columbus Community Map. This interactive map and dashboard is designed to help City staff, community partners, and stakeholders better understand Columbus neighborhoods, priorities, and ongoing initiatives—all in one place.
How this tool is used
- Supports both internal coordination and external engagement
- Helps staff and partners work from a shared, transparent view of data
- Designed to evolve as boundaries, priorities, and projects change
Getting Started
Use the left side panel to explore data layers, make custom selections, or download and share insights to support your work in the community.
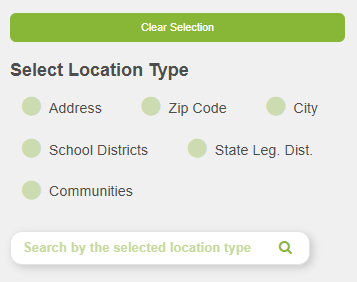
Search and Select
Find a place, select geographies, and build the map area you want to explore.
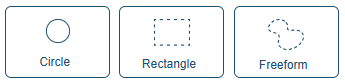
Custom Area Select
Draw circles, rectangles, or freeform areas to focus analysis on a custom boundary.
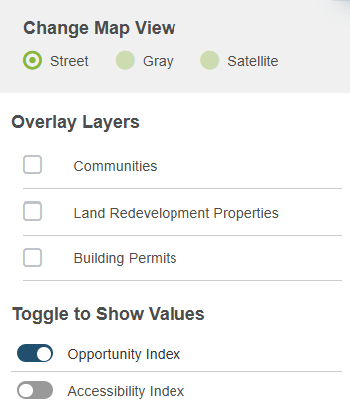
Map Options
Switch base maps, turn overlays on and off, and choose the values shown on the map.
Show Dashboard
JOIN SHAPES
CANCEL
Clear Parcels
The Community Opportunity Map displays child and family well-being indicators across communities. Use the map controls to explore neighborhoods, toggle layers, and review related details.
JOIN SHAPES
CANCEL